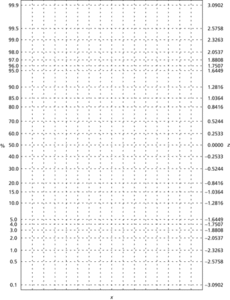
Specialized graph paper that can be used to help decide whether a sample of n observations is consistent with a normal distribution. The observations are ranked in order: x(1)≤x(2)≤⋯≤x(n) and pj, the proportion of values in the sample that are less than or equal to x(j), is plotted against x(j) on the graph paper. A sample from a normal distribution will appear as a series of approximately collinear points. A strong departure from linearity in the central region of the graph will provide an indication that the distribution is not normal.
In order to get a better idea of the behaviour in the extremes of the distribution, the observations may be replaced by their absolute values before being arranged in order. The resulting plot, with the theoretical probabilities appropriately adjusted, is a half-normal plot. See also Q-Q plot.

Normal probability paper. Plotting the sample cumulative proportions on this paper will result in an approximate straight line if the data have arisen from a normal distribution.
- screen
- screen dump
- screened cable
- screen editor
- screened pair
- screen grid
- screening
- screening router
- screening test
- screen resolution
- screen saver
- screensaver
- scree plot
- screw
- screw dislocation
- screw pump
- scribing
- scribing channel
- scrip issue
- script
- scripting
- scripting language
- script theory
- scRNP
- Scroggs’ property