A graphical representation of numerical data, introduced by Tukey and based on the five-number summary. The diagram has a scale in one direction only. A rectangular box is drawn, extending from the lower quartile to the upper quartile, with the median shown dividing the box. ‘Whiskers’ are then drawn extending from the end of the box to the greatest and least values. Multiple boxplots, arranged side by side, can be used for the comparison of several samples.

Boxplot. The basic boxplot illustrates five key values: the minimum value, the maximum value, the quartiles, and the median.
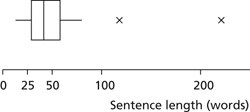
In refined boxplots the whiskers have a length not exceeding 1.5×the interquartile range (see quartile). Any values beyond the ends of the whiskers are shown individually as outliers.

Refined boxplot. In this diagram, individual outliers are indicated. The data illustrated are the lengths of the first eighteen sentences of A Tale of Two Cities by Charles Dickens. The first sentence—‘It was the best of times, it was the worst of times,…’—stretches to 118 words, and the fourteenth sentence has 221 words.
http://www.analyzemath.com/statistics/boxplot.html Applet.
A simple display of an observed frequency distribution in which the main body of the data between the 10th and 90th percentile are displayed as a rectangular box, divided at the median, while the lower and upper portions are indicated by lines drawn to the extreme values of the range.
- microperthite
- microphagous
- microphenocryst
- microphone
- microphony
- microphyll
- micropipeline
- micropipette
- micropiracy
- microplate
- micropore optics
- microporphyritic
- microprocessor
- microprogram
- microprogramming
- microprogram sequencer
- microprogram store
- micropropagation
- micropulsations
- micropygous
- micropyle
- microquasar
- microrelief
- microrheology
- microRNA