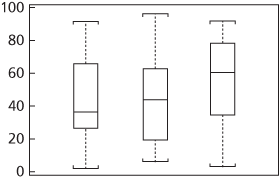
A diagram constructed from a set of numerical data showing a box that indicates the middle 50% of the ranked observations together with lines, sometimes called ‘whiskers’, showing the maximum and minimum observations in the sample. The median is marked on the box by a line. Box plots are particularly useful for comparing several samples.

Box plot with whiskers
The figure shows box plots for three samples, each of size 20, drawn uniformly from the set of integers from 1 to 100.
- Fizeau, Armand Hippolyte Louis (1819–96)
- Fizeau’s method
- fjard
- fjord
- FK
- FK Comae Berenices star
- f-k space
- flaccid designator
- flaccid((in botany))
- Fladbury
- flag
- flag carrier
- flagellate
- flagellum
- flag of convenience
- flagpole
- flagstone
- flake tectonics
- flakiness index
- flaking
- flaky
- flame
- flame bucket
- flame cells
- flame deflector