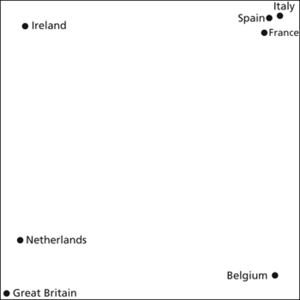
A multivariate method, resembling principal components analysis, that gives a graphical representation of the main characteristics of a proximity matrix using only a few dimensions. The success of the method is assessed by comparing the ‘distances’ between individuals as recorded by the proximity matrix with the (suitably scaled) Euclidean distances (see distance measure) in the full-dimensional space; the resulting measure of goodness-of-fit is called the stress (also called Kruskal stress) of the solution—a low value suggests a good solution.
Great Britain
Ireland
Nether- Lands
Belgium
France
Italy
Spain
Great Britain
20
11
11
6
7
2
6
Ireland
11
20
11
10
11
10
10
Netherlands
11
11
20
12
11
6
6
Belgium
6
10
12
20
12
11
9
France
7
11
11
12
20
10
12
Italy
2
10
6
11
10
20
13
Spain
6
10
6
9
12
13
20
The proximity matrix shows, for seven European countries, the numbers of food products (out of twenty) that were found to similar extents (i.e. common in both countries or scarce in both countries) in each of the pairs of countries. The biggest difference is between Great Britain and Italy: this is reflected in a two-dimensional graph of the positions (in this respect) of the countries .

Multidimensional scaling of countries and food products. The results may appear surprising, but they reflect the (very crude) information from which they were derived. The (unlabelled) axes reflect different aspects of eating behaviour.
- MCPC
- MCSs
- MCT
- McTaggart, John McTaggart Ellis (1866–1925)
- MD2
- MD5
- tweet
- tweeter
- Twenhofel, William Henry (1875–1957)
- Twentieth Congress (February 1956)
- Twenty‐One Demands
- twiddle
- twilight
- twin axis
- twin cable
- twin-earth
- twin gliding
- twinkling
- twin law
- twinning
- twin paradox
- twin plane
- twin primes
- TWINS
- twins