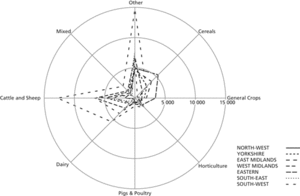
Also referred to as radar plot or star plot, this is a plot that can be more effective than a multiple bar chart for comparing small amounts of multivariate data.

Spider plot. The plot shows the numbers of farms of different types in different regions of England. There are many cattle and sheep farms in the South-West, whereas cereal farms predominate in the East.
- quota sample
- quota sampling
- quotation
- quoted company
- quote-driven market
- quoted text
- quotient
- quotient group
- quotient ring
- quotient rule(for differentiation)
- quotient space
- Qu’ran
- Q-value
- q-valued
- Q‐factor
- Q‐wave
- R
- R2
- RA
- Ra
- rabbit
- Rabi, Isidor Isaac
- Rabi model
- Rabin, Yitzhak (1922–95)
- Rabi oscillations