If the n pairs of values of random variables X and Y in a random sample are denoted by (x1, y1), (x2, y1),…, (xn, yn), the sample correlation coefficient r is given by
 where
where and Syy is defined analogously to Sxx. If the sample means are denoted by and , alternative definitions are
 The coefficient r can take any value from −1 to 1, inclusive. When increasing values of one variable are accompanied by generally increasing values of the other variable then r > 0 and the variables are said to display positive correlation. If r < 0 then the variables display negative correlation.
The idea of correlation was put forward by Galton in 1869, and it was Galton who was the first to denote it by the symbol r in 1888. The formulae given here were introduced by Karl Pearson in 1896.
The sample correlation coefficient r is an estimate of the population correlation coefficient ρ.
Correlation is closely linked to linear regression. If the least squares regression lines of y on x and of x on y for the sample (x1, y1), (x2, y2),…, (xn, yn) are, respectively, y=a+bx and x=c+dy then r2=bd.
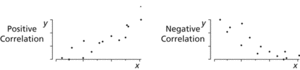
Sample correlation coefficient. When the correlation between two variables is positive, the values of one variable generally rise as the values of the other variable rise. The correlation is negative if the values of one variable generally rise as the values of the other fall.
In a hypothesis test, to test for significant evidence of a linear relationship between X and Y, we compare the null hypothesis that ρ=0 with the alternative hypothesis that ρ≠0, rejecting the null hypothesis if |r | is too large. See also coefficient of determination; rank correlation coefficient.
http://www.stat.tamu.edu/~west/ph/coreye.html Applet.
- William of Ockham
- William of Ockham (1290)
- William, Prince (1982–)
- Williams, Bernard Arthur Owen (1929–2003)
- Williams, Dave (1954– )
- Williams, Donald Edward (1942–2016)
- Williams, Eric (1911–81)
- Williams, Jeffrey Nels (1958– )
- Williamson, Alexander William
- Williamson’s synthesis
- Williams, Robert R.
- Williams, Robley Cook
- Williams, Roger (1603–83)
- Williams, Suni (1965– )
- Williams test
- Williams-tube store
- willingness to pay
- willow herb
- Willstätter, Richard
- will to believe
- will to power
- Wilmington, Spencer Compton, Earl of (1673–1743)
- Wilson, Allan Charles
- Wilson, Charles Thomson Rees
- Wilson, Charles Thomson Rees (1869–1959)