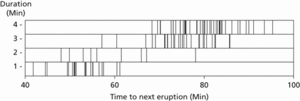
An arrangement of short parallel bars whose locations indicate the values of one or more variables.

Rugplot. For the Old Faithful data. Each bar indicates an inter-eruption time of the indicated length. The four rows correspond to eruptions of different durations.
- velocity potential
- velocity profile
- velocity ratio
- velocity reversal hypothesis
- velocity-sensitive keyboard
- velocity survey
- velocity–distance relation
- velocity–time graph
- VELOX-1
- VELOX-CI
- velum
- velvet worms
- vena cava
- vena contracta
- venation
- vendavale
- Vendian
- Vendobionta
- Venera
- Veneti
- Venezuela
- Venezuelan Remote Sensing Satellite-1
- Venice system
- Vening-Meinesz, Felix Andries (1887–1966)
- Venizélos, Eleuthérios (1864–1936)