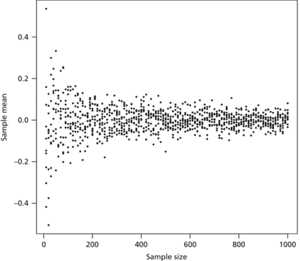
A plot used when collating findings from independent studies of the same topic (for example, the outcome of a medical treatment). The plot is a scatter diagram of the estimated treatment effects in the individual studies against the study size. Small studies will give more variable estimates and hence greater scatter. Thus the diagram should give the appearance of a funnel. The plot is used to check for publication bias (since, in small samples, the extreme estimates may have been published, whereas the less extreme estimates may not have been reported).

Funnel plot. Each point indicates the mean of a random sample taken from a standard normal distribution. Apparently unusual results are more likely when the sample size is small.
- Ophiuroidea
- opiate
- opinion poll
- opioid
- opioid receptor
- Opisthobranchia
- opisthodetic
- opisthogyral
- opisthogyrate
- opisthokonts
- opisthoparian suture
- opisthosoma
- opium
- Opium Wars (1839–42)
- Opoitian
- opossum
- Oppel, Albert (1831–65)
- Oppel zone
- Oppenheimer, Julius Robert
- Oppenheimer, Robert (1904–67)
- Oppenheimer–Volkoff limit
- opportunism
- opportunistic
- opportunist species
- Opportunity