See directional data.
Data consisting of directions or times in which the measurement scale is cyclic (after 23.59 comes 00.00, after 359° comes 0°, after 31 December comes 1 January). In the case of two-dimensional directions the data may be referred to as circular data or directional data (for data in three dimensions, see spherical data).
For observations θ1, θ2,…, θn, the variability of the data is measured by the concentration, R¯, defined by


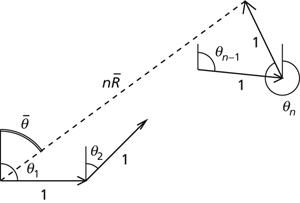
Cyclic data. Each data item is represented by a unit vector. The diagram shows the first two such vectors, and also the last two. The resultant vector, with length nR¯, connects the start of the first unit vector to the end of the last unit vector. The direction of the resultant vector is θ¯.
The circular mean, θ¯, is defined only when R¯≠0 and is then the angle (0°≤θ¯ <360°) such that

One way of representing cyclic data is to regard each observation as a move of length 1 unit in the stated direction. The quantity R is therefore the length of the resultant vector. The complete sequence of such moves, taken in any order, will end at a finishing point that is a distance R = nR¯ from the start. The direction of this finishing point from the start will be the angle θ¯. See also circular distribution.
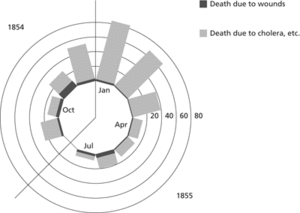
For cyclic data the histogram is replaced by the circular histogram (apparently first used by Florence Nightingale as a means of representing the numbers of deaths in the Crimean War) or the rose diagram.

Circular histogram. Florence Nightingale invented this diagram to illustrate that the main cause of death in the Crimean War was disease rather than the enemy. The reduction in deaths after March 1855 illustrates the efficacy of Nightingale's measures to reduce disease.
- Onsager, Lars
- Onsager relations
- Onsala Space Observatory
- ON star
- Ontarian
- on the fly
- on-the-fly error recovery
- on-the-job training
- ontic
- onto
- onto function
- ontogenetic heterochrony
- ontogeny
- ontological argument
- ontological commitment
- ontology
- Onufrienko, Yuri Ivanovich (1961– )
- Onverwacht
- Onychophora
- onyx
- oo-
- oobiosparite
- oocyte
- OOD
- oogamy