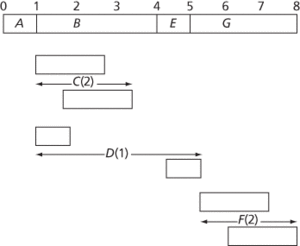
A graphical way to represent the solution following a critical path analysis. The critical activities are drawn across the top, and non-critical activities are displayed in the figure, showing pairs of bars where the activity is carried out as early and as late as possible without causing a delay.

cascade charts
- papacy
- papagayo
- papain
- Papal States
- papaya
- Papen, Franz von (1879–1969)
- paper capacitor
- paper chromatography
- paper mail
- paper shale
- paper slew
- paper tape
- paper tape I/O
- paper throw
- paper white display
- papilla
- Papineau’s Rebellion (1837–38)
- papovavirus
- pappus
- Pappus of Alexandria
- Pappus of Alexandria (ad 320)
- Pappus’ Centroid Theorems
- Pappus’ Hexagon Theorem
- Papua New Guinea
- PAR