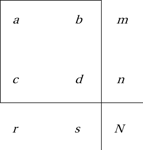
A two-way table with two rows and two columns. Let a, b, c, and d denote the frequencies of the four (2 × 2) possible outcomes, with m, n, r, s, and N the totals of these frequencies as indicated in the table
A question of interest is whether the classifying variables are independent. This is best tested using the Fisher exact test (introduced by Sir Ronald Fisher in 1935). The test involves the use of the hypergeometric distribution to calculate the probability of the observed outcome, given the observed values of the marginal totals m, n, r, and s, under the null hypothesis of independence. The probability of the observed outcome is given by

As an example, suppose that five out of six patients treated with drug A recover, whereas only three out of five patients treated with drug B recover. The null hypothesis is that the outcome was independent of the drug used. The possible outcomes (and their probabilities) are as follows:
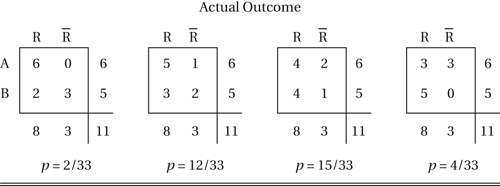
where R denotes recovery and denotes non-recovery. Given the fixed marginal totals (6, 5, 8, 3), the probability of the observed outcome, or one in which drug A is more successful, is . Similarly, the probability of the observed outcome, or one in which drug B is more successful, is . Since neither nor is unusually small, the null hypothesis of independence is accepted.
The exact test is now routinely included in statistical packages, since the underlying theory is not restricted to the two-by-two table. However, for the two-by-two table, when the cell frequencies are large, a useful alternative is the Yates-corrected chi-squared test for which the test statistic is
 where the (which is in fact a continuity correction) is called the Yates correction. The value of X2c should be compared with a chi-squared distribution with one degree of freedom.
In some cases it may be reasonable to suppose that the classifying variables have a bivariate normal distribution (see multivariate normal distribution) but have been reported with respect to some cut-off values of interest (e.g. ‘< 1’), with the true values being unreported. A question of interest is the value of the population correlation coefficient, ρ. One approximate estimate of ρ is provided by Yule’s Q (suggested by Yule in 1900), which is given by
 If the null hypothesis of independence between the classifying variables is correct and if the cell frequencies (see contingency table) are not too small, Q has an approximate normal distribution with mean 0 and variance estimated by
 A better approximation to ρ, proposed by Karl Pearson in 1901, is the tetrachoric correlation coefficient:
 If there are more than two rows or columns then the corresponding statistic is called the polychoric correlation coefficient.
An alternative assessment of association is provided by the odds ratio:
 This is the ratio of the odds on something occurring in one situation to the odds of the same event occurring under a second situation. An odds ratio of 1 implies that the odds on an event occurring (and hence the probability of its occurrence) are unaffected by the change in situation: they are independent of the situation. The interaction parameters of log-linear models can be interpreted in terms of odds ratios (or ratios of odds ratios). If any frequencies are zero then the Haldane estimator (proposed by Haldane in 1955),
 is more useful. An alternative is the Jewell estimator:
 Two-by-two tables are often used in a medical context. Typically, the rows of the table might refer to two different medicines and the columns to their success or failure. The question is whether there is a difference between the medicines. The relative risk is the ratio
 A related context is that of screening patients for diseases. Each patient in a sample, who may or may not have a disease, is tested for that disease. The test gives either a positive result or a negative result. The four possible outcomes are shown in the table, together with the corresponding frequencies a, b, c, and d:
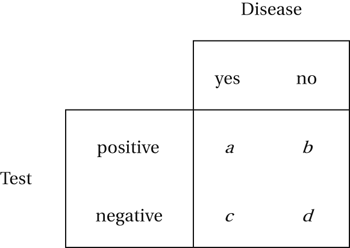
Sensitivity is the conditional probability of the test correctly giving a positive result, given that the patient does have the disease. An estimate is a/(a+c). Specificity is the conditional probability of the test correctly giving a negative result, given that the patient does not have the disease. An estimate is d/(b+d). Youden’s index, J, proposed by Youden in 1950, is given by

This provides a single summary measure of the efficiency of the screening procedure.
Sensitivity may be referred to as the true-positive rate, with (1−specificity) being called the false-positive rate or the false alarm rate. Often the test involves calculation of a score and assessing whether the score exceeds a critical value. In that case the sensitivity and specificity of the test will depend on that critical value. As an example, consider a classification procedure that states that patients with scores greater than k (for some k) are diseased, and the remainder are normal. The scores, together with information on the true states of the patients is given in the following table:
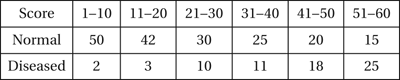
Thus, with k=30, the procedure correctly classifies 54 diseased patients (sensitivity=54/69) with a specificity of 122/182.
A plot , as the critical value changes, of the false-positive rate (on the x-axis) against sensitivity (on the y-axis) is known as an ROC curve (the acronym is of receiver operating characteristic curve, and has its roots in electrical engineering).
An alternative to the ROC curve is the detection error tradeoff graph (DET graph) which makes differences between alternative classifiers more apparent. The graph makes use of probits and plots the false-positive rate against the false-negative rate. Denoting the cumulative distribution function of a normal distribution by Φ, Φ−1[b/(b+d)] is plotted on the x-axis against Φ−1[c/(a+c)] on the y-axis .
In the context of significance tests the previous table could be labelled as shown:
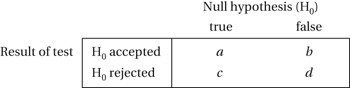
In this context the expected value of the ratio c/(c+d) is called the false discovery rate (FDR).
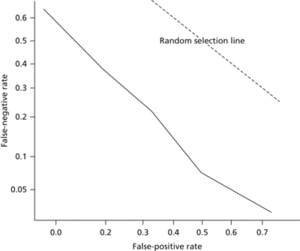
DET graph. A plot comparing the false-positive and false-negative rates, using probit transformations. An ROC curve is replaced by a near-straight line, making differences between alternative classifiers more apparent. The dotted line corresponds to classification at random.
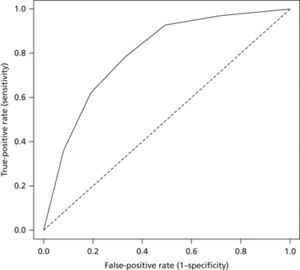
ROC curve. A plot of the false-positive rate against the true-positive rate for the tabulated data. In general, the greater the area below the ROC curve, the better the classification.
- poles
- Poleshchuk, Alexander Fedorovich (1953– )
- pole star
- pole-zero plot
- Poliakov, Valeri Vladimirovich (1942– )
- police state
- policy coordination
- policy file
- policy instrument
- polis
- Polish Corridor
- polished section
- polished stone value
- polishing
- polishing relief
- Polish logic
- Polish notation
- Polish Succession, War of the (1733–38)
- Politburo
- political business cycle
- political ecology
- political economy
- political geography
- politics of place
- politics, philosophy of