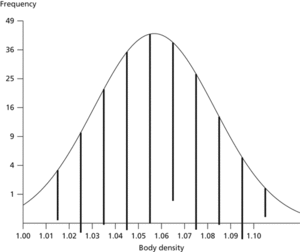
A diagram suggested by Tukey in 1971, for comparing an observed bar chart or histogram (with equal-width

Hanging rootogram. The data are the body densities (in gm/cm3) of 200 men. The diagram suggests that a normal distribution provides an acceptable description.
categories) with a theoretical probability distribution. The comparison is made easier by ‘hanging’ the observed results from the theoretical curve, so that the discrepancies are seen by comparison with the horizontal axis rather than a sloping curve. As in the rootogram, the vertical axis is scaled to the square-root of the frequencies so as to draw attention to discrepancies in the tails of the distribution.
- PANTONE
- pantothenic acid
- Pantotheria
- pantry food
- papacy
- papagayo
- papain
- Papal States
- papaya
- Papen, Franz von (1879–1969)
- paper capacitor
- paper chromatography
- paper mail
- paper shale
- paper slew
- paper tape
- paper tape I/O
- paper throw
- paper white display
- papilla
- Papineau’s Rebellion (1837–38)
- papovavirus
- pappus
- Pappus of Alexandria
- Pappus of Alexandria (ad 320)