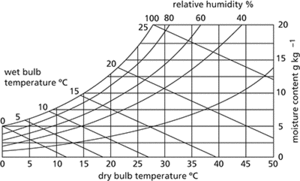
A graphical representation of the thermodynamic properties of water and air with dry bulb temperature on the y-axis and moisture content on the x-axis (see Fig. 45). Other characteristic curves and lines include wet bulb temperature and relative humidity (shown here), and specific volume and enthalpy of humid air (not shown here). The charts are usually presented at atmospheric pressure and are used for the design of air-conditioning systems and water-cooling towers.

Fig. 45
- counter-party
- Oldham, Richard Dixon
- Oldham, Richard Dixon (1858–1936)
- Oldowan
- old quantum theory
- Old Red Sandstone Continent
- Oldshue–Rushton column
- Old Style date
- Old Tom the Killer Whale
- Olduvai
- OLE
- oleaginous
- oleate
- olecranon process
- OLED
- olefines
- olefins
- oleic acid
- Olenekian
- Olenelloidea
- oleosome
- oleum
- olfaction
- olfactory lobe
- oligimer