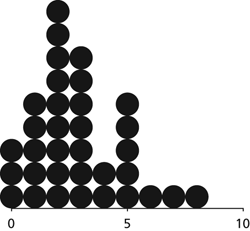
An alternative to a bar chart or line graph when there are very few data values. Each value is recorded as a dot, so that the frequencies for each value can easily be counted.

Dot plot. The diagram illustrates the numbers of goals scored in football games on one particular day. The modal number of goals was 2.
- chartered company
- charter group
- Chartism
- chartist
- chart recorder
- chasma
- chassignite
- chassis
- chastity
- chat
- chatbot
- chat channel
- chat client
- Chatelier, Henri Louis Le
- Chatham, 1st Earl of
- chatoyance
- chatoyancy
- chat room
- chat server
- chat site
- Chattanooga Campaign (1863)
- chatter mark
- chattermark
- Chattian
- Chautauquan