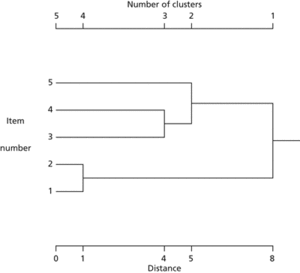
A diagram used in the context of cluster analysis to trace the stages in the aggregation (or disaggregation) of clusters. Thus, in the diagram opposite, reading from left to right, items 1 and 2 are the first to join together. Then 3 and 4 join together and are subsequently joined by 5. Finally, all five items join in a single cluster. The horizontal axis is used to indicate the distances at which the joins occur; in the example items 1 and 2 are much closer together than items 3 and 4.

Dendrogram. The horizontal distances at which joins occur indicate the distances between the items.
An alternative is the icicle plot, which is read from bottom to top. For the situation illustrated in the dendrogram the icicle plot is:
Item number
1
2
3
4
5
Number
1
X
X
X
X
X
X
X
X
X
of
2
X
X
X
X
X
X
X
X
clusters
3
X
X
X
X
X
X
X
4
X
X
X
X
X
X
5
X
X
X
X
X
Reading from the bottom we see that the icicles for items 1 and 2 join at the four–cluster step, with 3 and 4 joining at the three-cluster step, and so on.
See cluster analysis.
A diagram, similar to a family tree, that indicates some type of similarity between different organisms. Dendrograms can be based on phenetic or phylogenetic similarities; a cladogram shows similarities according to the system of cladistics.
A diagram that represents relationships among groups of taxa, with the highest taxon at the base of a vertical line from which lower taxa branch at appropriate levels. There are two principal types: (a) the phenogram, which is based solely on similarities in phenotypes; and (b) the cladogram.
- till fabric analysis
- Tillich, Paul (1886–1965)
- tillite
- tilloid
- till plain
- Tilly, Johannes Tserklaes, Count of (1559–1632)
- Tilsit, Treaties of (7)
- tilt-block
- tilt-block tectonics
- tiltmeter
- timarchy
- timbre
- time
- time-averaged velocity
- timebase
- timebase generator
- time bomb
- time-bounded Turing machine
- time complexity
- time constant
- TIMED
- time delay
- time dependence of fundamental constants
- time deposit
- time dilation