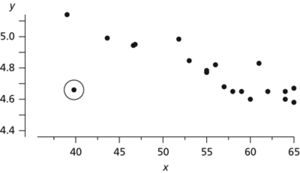
An observation that is deemed to be unusual and possibly erroneous because it does not follow the general pattern of the data in the sample. However, in some contexts it is the outliers which are the most important observations. See extreme value distribution.
An observation that is very different to other observations in a set of data. Since the most common cause is recording error, it is sensible to search for outliers (by means of summary statistics and plots of the data) before conducting any detailed statistical modelling.

Outlier. A small data set showing an obvious outlier. Whenever feasible, data should be plotted, since including an outlier will usually make nonsense of any calculations.
Various indicators are used to identify outliers. One is that an observation has a value that is more than 2.5 standard deviations from the mean. Another is that an observation has a value that lies more than 1.5I beyond the upper or the lower quartile, where I is the interquartile range (see boxplot).
If there is only a single outlier present, then an effective test for the presence of an outlier is the Dixon test. Denoting the ordered observations by y(1) ≤ y(2) ≤ … ≤ y(n) the test statistic (see hypothesis test) is either
 depending on whether y(n) appears unusually large, or y(1) appears unusually small. Special tables are required in order to determine significance.
For data from a normal distribution, the test statistic, G, of the Grubbs test, suggested by Grubbs in 1969, is

where and s are the sample mean and standard deviation.
The Rosner test for multiple outliers relies on ordering the n observations in terms of their distance from . Let ym be the observation that is the mth closest to and let the mean and standard deviation of the m−1 observations closest to the mean be and sm−1. The decision as to whether ym is an outlier is based on the value of

See residual.
Area where younger rocks are surrounded completely by older rocks. It may be produced by erosion, faulting, or folding, or any combination of these. Compare inlier.
An entry in a set of statistical data which lies a long way from any pattern apparent in the rest of the data set. The presence of an outlier suggests two possibilities which warrant further investigation. One is that something really exceptional occurred to cause it; such an occurrence is a shock. The other possibility is that the outlier occurred because of a mistake in recording or processing the data. See also inlier.
- hot key
- hot leaching process
- hot link
- hot linking
- hot list
- hot money
- HOTOL
- hot pressing
- hot site
- hot spot
- hotspot
- hot spring
- Hotspur
- hot surface ignition temperature
- hot swapping
- hot tapping
- Hottel charts
- hot towers
- hot-wire ammeter
- hot wire anemometer
- hot-wire gauge
- hot-wire instrument
- hot work
- hot working
- Hounsfield, Sir Godfrey Newbold