A diagram representing grouped numerical data in which cumulative frequency is plotted against upper class boundary, and the resulting points are joined by straight line segments to form a polygon. The polygon starts at the point on the x-axis corresponding to the lower class boundary of the lowest class. See also ogive; step diagram.
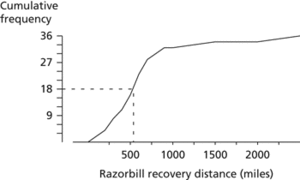
Cumulative frequency polygon. The diagram refers to the distances between the breeding colony and the point of recovery for a group of razorbills. The outline is typical, with slow increases at the left and right ends of the polygon indicating the scarcity of the corresponding values.
- Hallian
- Hall, James (1761–1832)
- Hall, James (1811–98)
- Hall mobility(symbol: μH)
- halloysite
- Hall, Peter Gavin (1951–2016)
- Hall probe
- hallucination
- hallucinogen
- hallux
- Hall–Heroult cell
- Hall–Héroult smelting process
- Hall’s Theorem
- Halmos, Paul Richard (1916–2006)
- halmyrolysis
- halo
- haloalkanes
- halo, atmospheric
- halocarbons
- haloclasty
- halocline
- halo CME
- halo effect
- haloform reaction
- haloforms