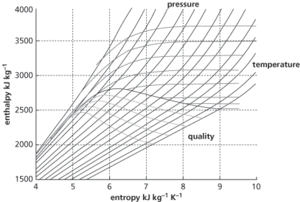
The graphical representation of the thermodynamic properties of a pure substance with enthalpy on the y-axis and entropy on the x-axis. Other properties are also included on the chart (see Fig. 29), including pressure and temperature, and the critical point. They are used to visualize thermodynamic cycles such as in power plants, refrigeration, and air conditioning. It is named after German physicist Richard Mollier (1863–1935).

Fig. 29
- Stuart
- Stuart, Charles Edward
- Stuart, James
- Stuart, Mary
- Stuart–Maxwell test
- stub
- Stubs’ Wire Gauge
- Student
- Studentized range distribution
- Studentized residual
- student revolts
- Student’s t distribution
- Student’s t-distribution
- study population
- StuffIt
- Sturckow, Frederick Wilford (1961– )
- sturdy beggars
- sturgeon
- Sturgeon, William
- Sturm und Drang
- Sturm–Liouville equation
- Sturtevant, Alfred Henry
- Sturtian
- sturzstrom
- STV