See sets.
A method of displaying relations between subsets of some universal set. The universal set E is represented by the interior of a rectangle, say, and subsets of E are represented by regions inside this, bounded by simple closed curves. For instance, two sets A and B can be represented by the interiors of overlapping circles, and then the sets A ∪ B, A ∩ B and A\\B = A ∩ B′, for example, are represented by the shaded regions shown in the figures.
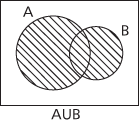
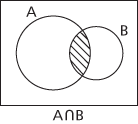
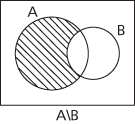
Given one set, A, the universal set is divided into two disjoint subsets A and A′, which can be clearly seen in a simple Venn diagram. Given two sets A and B, the universal set E is divided into four disjoint subsets A ∩ B, A′ ∩ B, and A ∩ B′ and A′ ∩ B′. A Venn diagram drawn with two overlapping circles for A and B clearly shows the four corresponding regions. Given three sets A, B and C, the universal set E is divided into eight disjoint subsets A ∩ B ∩ C, A′ ∩ B ∩ C, A ∩ B′ ∩ C, A ∩ B ∩ C′, A ∩ B′ ∩ C′, A′ ∩ B ∩ C′, A′ ∩ B′ ∩ C, and A′ ∩ B′ ∩ C′, and these can be illustrated in a Venn diagram as shown here.
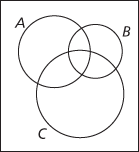
Venn diagram with three sets
Venn diagrams can be illustrative but should generally be avoided for careful proofs, because a diagram may only illustrate a special case. Four general sets, for example, should not be represented by four overlapping circles because they cannot be drawn in such a way as to make apparent the 16 disjoint subsets into which E should be divided. See also truth tables.
A simple diagram (see opposite) used to represent unions and intersections of sets. The diagram, described by Venn in 1880 and popularized by his 1881 book Symbolic Logic, had been introduced by Leibniz in the eighteenth century.
http://www.math.uah.edu/stat/applets/VennGame.html Applet.
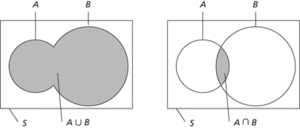
Venn diagram. These two diagrams illustrate the definitions of the union and intersection of the events A and B in the sample space S.
A schematic representation of a set, first used in the 19th century by John Venn. A universal set U will typically be represented by a rectangle, and a subset S of U by the interior of a circle (or another simple closed curve) lying wholly within the rectangle. Some examples are shown in the diagram. Where appropriate, the shaded areas represent the sets indicated beneath each figure.
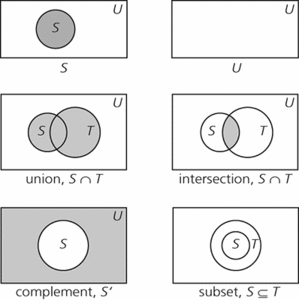
Venn diagram. Examples of Venn diagrams
A kind of diagram invented by Venn in 1881, for representing and assessing the validity of elementary inferences either of a syllogistic form, or from the Boolean algebra of classes (Venn was attempting to illustrate Boole’s own methods). In a Venn diagram for the syllogism there are three circles, corresponding to S, M, and P. Shaded areas indicate which combinations are empty, and a cross indicates which ones have members, while a cross on a border between two classes represents that at least one class has a member. For example, to illustrate the syllogism ‘Some S is M, all M is P, so some S is P’, the first premise is represented by (i). Here the cross hovers between the area of P and the area outside P. However, the second premise adds the shading of (ii), since any M region outside P is empty.
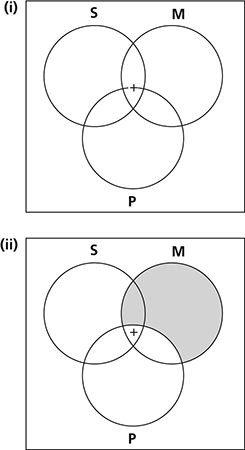
Hence, the cross cannot be there, and is driven into the P area. This shows that some S is indeed P; hence the syllogism is valid. Venn generalized the method. For statements in the algebra of classes involving four terms, ellipses can be drawn, but the method becomes cumbersome. Strips and charts of various kinds were invented in the late 19th and early 20th centuries to give graphical representations of such problems.
- Hubbard model
- Hubble classification
- Hubble constant
- Hubble diagram
- Hubble, Edwin (1889–1953)
- Hubble, Edwin Powell
- Hubble, Edwin Powell (1889–1953)
- Hubble flow
- Hubble law
- Hubble parameter
- Hubble parameter (H0)
- Hubble radius
- Hubble's law
- Hubble Space Telescope
- Hubble time
- Hubble–Sandage variable
- Hubble’s law
- Hubble’s Variable Nebula
- Hubel, David Hunter
- Huber function
- Huber, Peter Jost (1934)
- Huber, Robert
- hub polling
- hubris
- Huchra, John