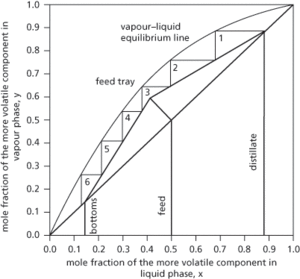
A rigorous graphical method used in the analysis of the separation of two heterogeneous liquids by distillation. It is used to determine the number of stages required to bring about a required separation, and is based on a stage-wise approach requiring vapour liquid equilibrium data between the two liquids presented in terms of the more volatile component. The diagram (see Fig. 28) presents the vapour liquid equilibrium data based on the more volatile component as the mole fraction in the vapour phase (y) and the mole fraction in the liquid phase (x). Molar balances over the stripping and rectifying sections of the distillation column provide operating lines. The step-wise lines represent the vapour liquid equilibrium on each theoretical tray or equilibrium stage and provide an indication of the total number of trays or stages required for a separation. The intercept of the stripping and rectification sections meets the q-line and represents the condition of the feed to the distillation column. The method assumes a constant molar overflow requiring constant molar heats of vaporization, that for every mole of liquid vaporized a mole of vapour is condensed, that there is no heat of mixing or solution, and that there is no heat transfer to or from the distillation column. The method was developed by American chemical engineers Warren L. McCabe (1899–1982) and Ernest W. Thiele (1895–1993) in 1925, but is now largely obsolete due to the use of computers able to carry out rapid and detailed calculations. Its simple graphical representation makes it a useful teaching tool. Compare ponchon–savarit.

Fig. 28
- private key
- private key crytography
- private language
- private network
- private property
- private/public distinction
- private sector
- private sector balance
- private space
- privatization
- privileged access
- privileged instructions
- pro-attitude
- probabilism
- probabilistic compaction
- probabilistic reasoning
- probability
- probability amplitude
- probability calculus
- probability density function
- probability distribution
- probability distribution((of a random variable))
- probability distributions
- probability function
- probability generating function