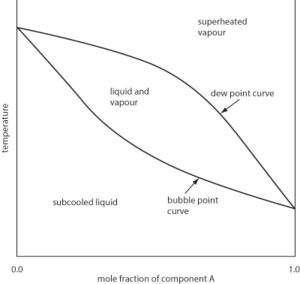
A diagram that is used to present the relationship between the boiling point and composition for two components at a given pressure (see Fig. 10). The x-axis ranges from 0 to 100 per cent for one component (i.e 100 per cent to 0 per cent for the other component) with the y-axis representing temperature. The diagram features two curves: the lower curve gives the boiling point temperature for the binary mixture, and the upper curve represents the composition of the vapour for that temperature. For an ideal mixture, the two curves coincide. However, deviations from Raoult’s law may show a maximum or a minimum where the composition of the liquid is the same as the vapour, and illustrates the existence of an azeotrope.

Fig. 10 Boiling point-composition diagram
- Columbus
- Columbus, Christopher (1451–1506)
- Columbus Control Centre
- columella
- column
- columnal
- columnar
- columnar epithelium
- columnar joint
- columnar section
- column chromatography
- column density
- column equivalence
- column-major order
- column operation
- column-ragged
- column rank
- column space
- column vector
- colure
- COM
- com-
- coma
- Coma Berenices
- Coma Cluster