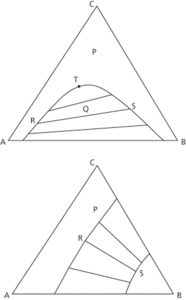
A graphical presentation of the interaction of three components in a mixture known as a ternary liquid system. The diagram (see Fig. 56) uses equilateral triangular coordinates, with each liquid being presented as either a mass fraction or percentage in terms of the other two. Any point on the side of the diagram represents a binary mixture. Where one pair of liquids is partially soluble in each other and both are fully soluble in the third at a particular temperature, the diagram is known as an isotherm. An example is benzene, water, and acetic acid with benzene dissolving completely in the other two. For example, in Fig. 56a, any ternary liquid outside the solubility curve at P is a homogenous solution of one liquid. Any ternary liquid below at Q will form two insoluble, saturated liquid phases of equilibrium compositions R and S. The line RS is the tie line, which passes through Q. The plait point T is the last tie line and the point where A- and B-rich solubility curves merge. Where the two pairs of liquids are partially soluble, such as chlorobenzene (A) and water (B), and water and methyl ethyl ketone (C), the isotherm appears as Fig. 56b. Homogeneous ternary solutions are formed at P while two liquids phases at equilibrium appear with R and S corresponding to tie lines in the heterogeneous area.

Fig. 56a and 56b
- Gibbs sampler
- Gibbs–Duhem equation
- Gibbs–Helmholtz equation
- Gibbs’ inequality
- Gibbs’ phase rule
- gibi-
- gibibit
- gibibyte
- Gibson, Edward George (1936– )
- Gibson, Robert Lee (1946– )
- GIC
- Gidzenko, Yuri Pavlovich (1962– )
- GIF
- GIF89A
- GIF animation
- GIF animation tool
- Giffen good
- gift tax
- giga-
- gigabit
- Gigabit Ethernet
- gigabyte
- gigantic jet
- gigantism
- Gigantoproductus giganteus