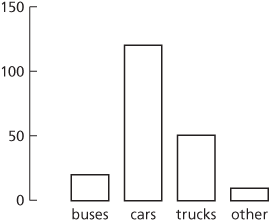
A diagram representing the frequency distribution for nominal or discrete data. It consists of a sequence of bars, or rectangles, corresponding to possible values, and the length of each is proportional to the frequency. The figure shows the kinds of vehicles recorded in a small traffic survey. Compare histogram.

Bar chart representing traffic survey
A diagram (opposite) for showing the frequencies of a variable that is categorical or discrete. The lengths of the bars are proportional to the frequencies. The widths of the bars should be equal. If the widths of the bars are negligible then the diagram may be called a line graph. Diagrams resembling bar charts were used in a theoretical context in the 14th century. See also compound bar chart; multiple bar chart.

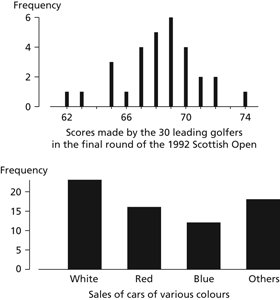
Bar chart. The top diagram is a bar chart for a discrete variable (note that 0 need not appear); the bottom diagram illustrates data for a categorical variable. The choice of width for the bars is arbitrary, but the width should not be the same as that of the gap between successive bars.