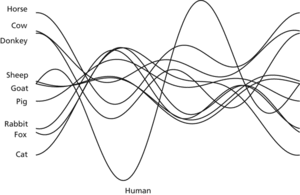
A plot suggested in 1972 by the American David Andrews as an alternative method to Chernoff faces for representing multivariate data in two dimensions. The plot can help to identify outliers and to establish similarities within groups of data items. For an item with values given by the row vector (a b c d e…), the function x(t) is defined as
 The resulting graph is drawn for (−π≤t≤π), for each data item. The form of the graph is dependent upon the ordering of the characteristics a, b,…; the usual advice is to order the characteristics in declining order of their (supposed) importance.
Andrews plot. This plot compares humans with nine familiar animal species, using five characteristics (body weight, brain weight, hours of sleep, lifespan, and gestation). It appears that humankind is a race apart and that it is difficult to tell the sheep from the goats.
- lithophysae
- lithosequence
- lithosiderite
- lithosome
- lithosphere
- lithospheric plate
- lithostatic stress
- lithostratigraphic unit
- lithostratigraphy
- Lithothamnion
- Lithuania
- litmus
- litre
- litter
- Little, Arthur Dehon (1863–1935)
- Little Big Horn, Battle of (25 June 1876)
- Little Climatic Optimum
- Little Dipper
- Little Dumbbell
- little endian
- little-endian
- Little Entente (1920–38)
- Little Ice Age
- Little Joe rocket
- little o notation