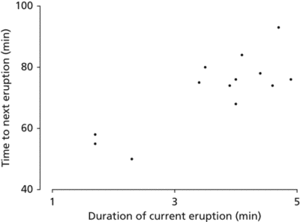
A 2-dimensional diagram showing the points corresponding to n paired-sample observations (x1,y1),(x2,y2),…,(xn,yn), where x1, x2,…, xn are the observed values of the explanatory variable and y1, y2,…, yn are the observed values of the dependent variable.
The simplest display when the data consists of pairs of values. The data are plotted as points using Cartesian coordinates. If the data are ordered (for example, in time) then it may be sensible to join the successive points with a line. If there are other categorical variables, their values can be indicated using different plotting symbols or different colours. A quantitative third variable can be indicated by varying the size of the plotting symbol.

Scatter diagram. The diagram shows the Old Faithful data for 1 August 1974. Long eruptions are followed by long intervals before the next eruption.
In statistics, the diagram obtained when two sets of observations are plotted against each other. Scatter diagrams are usually employed to visualize any correlations that may occur between two sets of observations.
A diagram depicting the relation between two characteristics of a set of observations. Each point marked on the diagram shows an observation of the two characteristics, for example age and the income of an individual, measured on the two axes. This is often helpful in suggesting whether there is a likelihood of finding any significant statistical relation between the two characteristics, and what type of function it is worth trying to fit. It also draws attention to any outlying observations which may merit special investigation.
- moment generating function
- moment-generating function
- moment(in mechanics)
- moment(in statistics)
- moment magnitude scale
- moment method
- moment of a force
- moment of distribution
- moment of inertia
- moment of momentum
- momentum
- momentum balance
- momentum desaturation
- momentum space
- momentum wheel
- MON
- Monaco
- monad
- cavitation
- cavity QED
- cavity resonator
- Cavour, Camillo Benso, Conte di (1810–61)
- cavum
- cavus
- cavy