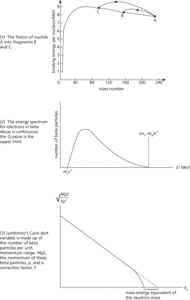
The total energy released in a decay process. The binding energy curve (see diagram 1) shows the fission of a nuclide A into its primary fission fragments B and C. B and C have greater binding energies per nucleon. The fragments gain stability (see nuclear stability) because there is no change in the total number of nucleons. The effective increase in binding energy per nucleon corresponds to a release of stored potential energy, which subsequently appears as either the kinetic energy of the primary fragments or as gamma radiation. The Q-value of a decay process is therefore equal to the increase in binding energy of the decay products. For example, 236U (uranium–236) undergoes a decay process in which two fission fragments are formed, 146La (lanthanum–146) and 87Br (bromine–87):
The total binding energy of the products is 1975.19 MeV, whereas the binding energy of the uranium nucleus is 1791.24 MeV. The increase in binding energy is therefore 183.95 MeV; the Q-value for this fission process is said to be 184 MeV. The possible existence of neutrino mass may lead to a modification of published Q-value tables of beta particle energies. As the energy spectrum for electrons emitted in beta decays is continuous, the upper limit of the spectrum is the Q-value (see diagram 2). If an emitted electron were to carry away this maximum energy there would be no more energy to make up the mass of the neutrino, however small that may be. Experiments have been conducted that establish bounds on neutrino masses, with more experiments of this type planned to establish tighter bounds.

Q-value.
- molecular motor
- molecular orbital
- molecular-orbital theory
- molecular recognition
- molecular robot
- molecular rotations
- molecular self-assembly
- molecular shape
- molecular sieve
- molecular sieve action
- molecular spintronics
- molecular symmetry
- molecular systematics
- molecular vibrations
- molecular volume
- molecular weight
- molecule
- mole drain
- mole fraction
- molfile format
- Molina, Luis de (1535–1600)
- Molina, Mario José
- Molinism
- Molisch’s test
- mollic horizon