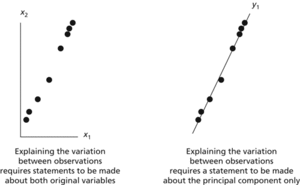
A technique for making multivariate data easier to understand. Suppose that there is information on n variables for each data item. These variables are unlikely to be independent of one another; a change in one is likely to be accompanied by a change in another. The idea of PCA is to replace the original n variables by m (<n) uncorrelated variables, each of which is a linear combination of the original variables, so that the bulk of the variation can be accounted for using just a few explanatory variables. In the diagram overleaf, the two original variables x1 and x2 can be replaced by the first principal component, y1.

Principal components analysis. Principal components analysis aims to explain an n-dimensional situation using m (<n) uncorrelated variables. Here n=2 and m=1.
Let R denote the correlation matrix for the case of p x-variables. The coefficients of the x-variables corresponding to the kth principal component are the elements of the eigenvector corresponding to the kth largest eigenvalue, λk, of R. All the eigenvalues are real and non-negative, since R is positive semi-definite. The proportion of the variation in the data explained by the kth principal component is . The first few principal components should account for the majority of the observed variation. The hope is that the linear combinations thus identified will have some natural interpretation. The Kaiser rule proposes that only components having eigenvalues greater than unity should be retained. See also scree plot.
Probably the oldest and best known of the techniques of multivariate analysis, this procedure reduces the dimensionality of a data set in which there are a large number of interrelated variables, while retaining as much as possible of the variation present in the data set. This is achieved by transforming to a new set of variables, the principal components, which are uncorrelated, and which are ordered so that the first few retain most of the variation present in all of the original variables. Demšar et al. (2013) AAAG 103, 1, 106 provide an excellent overview of PCA in spatial settings.
A technique based on the linear transformation of a multivariable data set into a smaller set of uncorrelated variables, called principal components. The first principal component accounts for as much of the variability in the data as possible, and each succeeding component accounts for as much of the remaining variability as possible. The method does not identify what these components are; this has to be inferred from outside knowledge about the processes behind the data.
- garter snake
- Garvey, Marcus Moziah (1887–1940)
- GAS
- gas
- gas amplification
- gas bladder
- gas breakdown
- gas cell
- gas centrifuge process
- gas chimney
- gas chromatograph/mass spectrometer
- gas chromatography
- gas chromatography infrared
- Gasconadian
- gas constant
- gas-cooled reactor
- gas-discharge tube
- gas electrode
- gaseous exchange
- gas equation
- gas exchange
- gas-filled tube
- gas formation volume factor
- gas giant
- gasification