A diagram in which percentages are shown as sectors of a circle. If x percent of the electorate vote for party X, y percent for party Y, and z percent for party Z, a pie chart would show three sectors having central angles 3.6x°, 3.6y°, and 3.6z°.
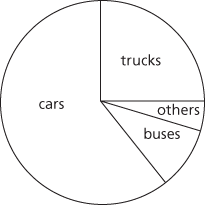
Suppose that some finite set is partitioned into subsets. A pie chart is a diagram consisting of a disc divided into sectors whose areas are in the same proportion as the sizes of the subsets. Florence Nightingale helped popularize the pie chart, though it was first introduced by William Playfair in 1801. The figure shows the kinds of vehicles recorded in a small traffic survey.
A pie chart
A diagram (see opposite) used when it is desired to emphasize the proportions of a set of data when data items are grouped into classes according to the value of some variable (usually categorical). A circle is divided into sectors representing the classes. The area (or equivalently the angle) of a sector is proportional to the frequency of the corresponding class. If two pie charts are used to compare two populations, their areas can be made proportional to the sizes of the populations.
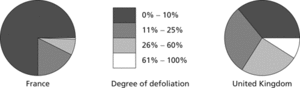
Pie chart. The charts contrast the amount of defoliation of conifers in France and the UK in 1989.
A diagram in which percentages are shown as sectors of a circle. If x percent of the prey of a carnivore comprises species X, y percent species Y, and z percent species Z, a pie chart would show three sectors having central angles 3.6x°, 3.6y°, and 3.6z°.
- comproportionation
- Compton, Arthur Holly
- Compton, Arthur Holly (1892–1962)
- Compton effect
- Compton Gamma Ray Observatory
- Compton Gamma-Ray Observatory
- Compton scattering
- Compton upscattering
- Compton wavelength
- compulsion
- compulsory purchase order
- CompuServe
- computability
- computability theory
- computable
- computable algebra
- computable function
- computable functions
- computable general equilibrium model
- computable number
- computable real number
- computable set
- computable structure
- computation
- computational chemistry