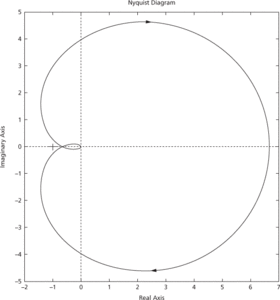
A type of frequency response diagram used for analysing the behaviour of a controlled system to a disturbance signal particularly in terms of assessing the stability with feedback. It involves plotting the magnitude and phase angle on a chart with frequency as a parameter. Using polar coordinates, the gain of the transfer function is plotted on the radial coordinate with the phase angle plotted as the angular coordinate. It is named after Swedish engineer Harry Nyquist (1889–1976). Compare nichols plot.
A plot of a transfer function in which, for each frequency, the real part is plotted on the horizontal x-axis, while the imaginary part is plotted on the vertical y-axis. Nyquist plots are a useful means of visually assessing the stability of a closed-loop control system with negative feedback. See also Bode diagram.

Nyquist plot
- Ockels, Wubbo Johannes (1946–2014)
- Ockham's razor
- Ockham, William of (c.1285–1349)
- Ockham’s razor
- OCO-2
- O'Connor, Bryan Daniel (1946– )
- OCR
- OC star
- octadecanoate
- octadecanoic acid
- octadecenoic acid
- octagon
- octahedral
- octahedrite
- octahedron
- octahydrate
- octal
- octal notation
- octane
- octane number
- octane number, rating
- octanitrocubane
- octanoic acid
- Octans
- octant