By analogy with a map, a diagram that illustrates how the value of one quantity, for example the likelihood of a set of data, varies with changes in the values of two parameters.
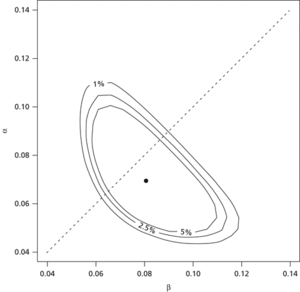
Contour diagram. The likelihood changes with the values of two parameters (Α, β). The maximum is indicated by the dot. The contours show values that differ significantly from the maximum at various levels. The dotted line of equality penetrates the inner contour indicating that the hypothesis that the parameters are equal is acceptable at the 5% level.
A stereographic equal-area net on which orientation data (i.e. the azimuths of structural features) are plotted as lines or points and then joined to form contours linking areas of equal density of data, thus providing a visual description of the range and concentration of the data. There are several ways to construct such diagrams manually or by computer, and there are statistical tests for evaluating the significance of the densities revealed.
- floating point
- floating-point notation
- floating-point operation
- floating-point representation
- floating production systems
- floating roof
- floating, storage, and off-loading unit
- floating‐point notation
- float of an activity(in critical path analysis)
- floatstone
- flocculation
- flocculent
- flocculi
- floccus
- Flock 1
- Flodden Field, Battle of (9 September 1513)
- flood
- flood basalt
- flood-fill
- flood forecasting
- flood frequency analysis
- flooding
- flood-peak formulae
- flood plain
- floodplain