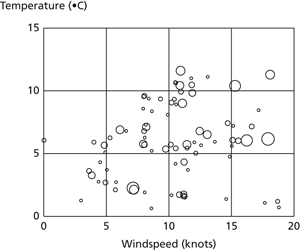
A scatter diagram using circles as plotting symbols in which the areas of the circles indicate the values of a third variable.

Bubble plot. The diagram displays the relation between windspeed and temperature near Bolton, England during March 2000. Each circle corresponds to an hour during which rain was recorded. The areas of the circles are proportional to the amount of rain.
- electroacoustics
- electroacoustic transducer
- electrocardiogram
- electrocardiograph
- electrochemical cell
- electrochemical equivalent
- electrochemical impedance spectroscopy
- electrochemical series
- electrochemistry
- electrochromatography
- electrocyclic reaction
- electrode
- electrode array
- electrode configuration
- electrode current
- electrodeposition
- electrode potential
- electrodialysis
- electrodynamic instrument
- electrodynamics
- electrodynamometer
- electroencephalogram
- electroencephalograph
- electroendosmosis
- electroforming