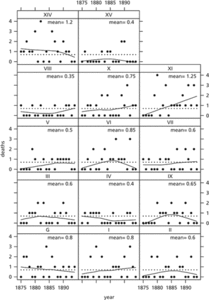
An array of plots, all having the same format, with each member of the array referring to a distinct subset of the entire data.

Trellis plot. The plot illustrates the data on Prussian horse kicks. Each panel refers to a separate corps. The overall yearly mean is shown as a dotted line, with separate trends shown for each corps using loess.
- ecological climatology
- ecological crisis
- ecological efficiency
- ecological energetics
- ecological equivalents
- ecological fallacy
- ecological footprint
- ecological imperialism
- ecological inference
- ecological modernization
- ecological niche
- ecological overshoot
- ecological politics
- ecological pyramid
- ecological restoration
- ecologic reef
- ecology
- e-commerce
- ecommerce
- ecommerce site builder
- Econometrica
- econometric model
- econometric models
- econometrics
- Econometric Society