A graphical representation of social inequality introduced by the American economist Max Otto Lorenz (1876–1959) in 1905 in connection with the distribution of wealth in a population. Let w be the total income of those members of a population whose income is at most v, and let W be the total income of the population. In the Lorenz curve, w/W is plotted against the (cumulative) proportion of the population that has income at most v. So, if f is the probability density function of income then the curve is the plot of


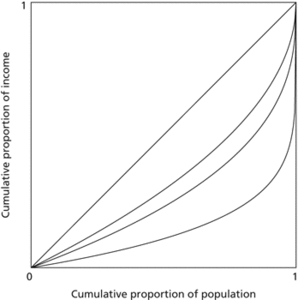
Lorenz curve. The curves shown result from Pareto distributions of income with parameter k equal to one and parameter a taking the values 1, 1.2, 1.6, and 2.
The ratio of the area between the Lorenz curve and the 45° line to the total area below that line is the Gini index (also called the Gini coefficient), G.
Suppose a sample of n individuals have incomes x(1)≤x(2)≤⋯≤x(n). The Lorenz curve is approximated by the polygon joining the origin to the successive points with coordinates
 If the corresponding income proportions are y(1)≤y(2)≤⋯≤y(n) then G can be calculated using
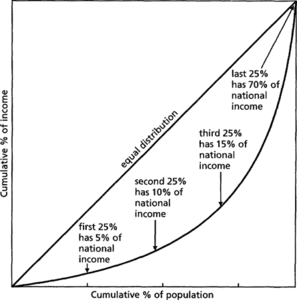
A cumulative frequency curve showing the distribution of a variable such as population against an independent variable such as income or area settled. If the distribution of the dependent variable is equal, the plot will show as a straight, 45° line. Unequal distributions will yield a curve. The gap between this curve and the 45° line is the inequality gap. Such a gap exists everywhere, although the degree of inequality varies.

Lorenz curve
See gini coefficient.
A graphical representation of inequality. Personal incomes in a country, for example, are arranged in ascending order: the cumulative share of total income is then plotted against the cumulative share of the population. The slope of this curve is thus proportional to per capita income at each point of the population distribution. For complete equality of income the Lorenz curve would be a straight line; it becomes more curved as inequality rises. Assume the Lorenz curves for two income distributions with the same mean income have been plotted. If the two Lorenz curves do not cross, the curve closest to being a straight line represents the income distribution with lower inequality. If the two Lorenz curves cross, no unambiguous ranking of the inequality of the two income distributions can be given. The Gini coefficient is equal to half the area between the Lorenz curve for an income distribution and the straight-line Lorenz curve representing the absence of inequality.
- trailing edge
- trailing edge((of a pulse))
- Trail of Tears
- train
- trained band
- training
- training area
- training sample
- training sequence
- training set
- train printer
- Trajan (53–117)
- trajectory
- trajectory correction manoeuvre
- tram
- tramontana
- tranche
- tranquil flow
- Tranquility module
- trans
- transactinide elements
- transaction
- transactional commerce
- transaction cost economics
- transaction costs