If {xi} is an ordered sequence of observations then the product moment correlation coefficient between pairs (xi, xi + 1) is the autocorrelation of lag 1, and between pairs (xi, xi + k) is the autocorrelation of lag k. The values of k for which the autocorrelation is not negligible can provide important information as to the underlying structure of a time series.
A mathematical operation used in signal processing, especially as the first stage in obtaining the spectrum of a radio source observed by a single antenna. The autocorrelation function of a signal is a measure of the degree to which successive segments of the signal resemble each other and is often used to produce a spectrum. See Autocorrelator.
A measure of the linear relationship between two separate instances of the same random variable, as distinct from the population correlation coefficient, ρ, which refers to the linear relationship between two different random variables. As with ρ, the possible values lie between−1 and 1 inclusive, with unrelated instances having a theoretical autocorrelation of 0.
In the case of a time series, autocorrelation measures the extent of the linear relation between values at time points that are a fixed interval (the lag) apart. Similarly, spatial autocorrelation quantifies the linear relationship between values at points in space that are a fixed distance apart (in any direction in the case of an isotropic process; see isotropy). It is usually found that spatial autocorrelation is near 1 for points close together and decays to 0 as the distance increases—thus the daily rainfalls at the Lords and Oval cricket grounds in London will resemble each other closely, but will bear little or no resemblance to the rainfalls at the Kensington Oval in the West Indies. The phrase ‘serial correlation’ was introduced by Yule in 1926, while ‘autocorrelation’ was first used in 1933 as a description of a (related) function used by Wiener in 1926.
For a random variable X at time (or location) t, the population autocorrelation function (ACF) for lag l, ρl , is given by
 the autocovariance function for lag l divided by the variance of Xt (which, for a stationary process, is equal to that of Xt+l). At low lags autocorrelation is usually positive. It usually declines towards 0 as the lag increases. See also partial autocorrelation function.
The sample autocorrelation for lag l, rl, is given (for l=1, 2,…, n−1) for the sequence of n values x1, x2,…, xn (ordered in space or time) by
 where x¯ is the sample mean.
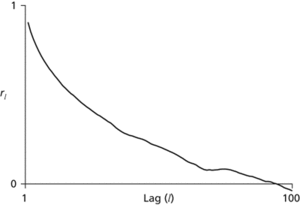
A plot of the variance of 1/{2(Xt−Xt+l)} against l is called a variogram (or semi-variogram). The related plot of autocorrelation versus lag is called a correlogram, and a plot of the autocovariance against lag may be called a covariogram. See also serial correlation; periodogram.

Autocorrelation. A correlogram showing a typical plot: the autocorrelation generally reduces as the lag increases.
See correlation.
The correlation of a wave-form with itself; a special case of cross-correlation. The autocorrelation function (ACF) is especially useful in the identification of multiples within a seismic record. While the ACF contains all the amplitude and frequency information of the original wave-form, it possesses no phase information.
A measure of the linear relation between the value of any item in a time series and those coming before or after it. First-order autocorrelation refers to the relation of each item to those immediately before or after. Positive autocorrelation means that deviations from the mean tend to persist from period to period; negative autocorrelation means that deviations from the mean tend to be reversed. Many macroeconomic time series, such as unemployment or the inflation rate, show positive autocorrelation. See also spatial autocorrelation.
- dot-blot
- dot chart
- dot com
- dot com bubble
- dotcom bubble
- dot com company
- dotcom company
- dot comify
- dot commerce
- dot diffusion
- dot generator
- dot matrix printer
- dot plot
- dot product
- dots per inch
- Dott classification
- dotted decimal notation
- dotted quad notation
- double-acting
- double amplitude
- double aspect theory
- double beta decay
- double-blind trial
- double block and bleed
- double bond