Computer graphics is the creation of, manipulation of, analysis of, and interaction with pictorial representations of objects and data using computers. The information may be a simple histogram, a complex map or engineering design with textual annotation, or a photorealistic rendered scene. Output-only computer graphics was used as early as the late 1950s. The first interactive graphics system that defined a number of the current paradigms was Sketchpad, devised by Ivan Sutherland at MIT Lincoln laboratory and published in 1963. On a computer screen, or on a printed page, all images are made up of pixels or dots in an array. However, there are two quite different ways in which the information is stored and manipulated, usually referred to as raster (or bitmap) graphics and vector graphics.
Raster graphics
This is the system used for scanned images and for photographs produced by a digital camera. It is suitable for complex pictures with a large number of different colours and shades. The image is stored as chunks of data, each representing the properties (e.g. colour, tint, transparency) of a small element of the picture. The overall picture is formed from lines in an analogous way to the picture on a television screen (hence the name ‘raster’). A large number of different file formats are used for raster graphics images, many native to the application. Some of the ones in general use are shown in the table.
Bitmap editors
Raster images can be viewed and changed using commercial raster (or bitmap) editors, such as Adobe PhotoShop or Corel Paint Shop Pro. Programs of their type allow images to be viewed and changed in a number of ways. They can be resized or distorted, parts can be cut and replaced by sections of other pictures, and various special effects can be applied (e.g. blurring, pixellating, bas relief). General properties such as brightness and contrast can be adjusted and selective colour changes can be made. Most raster editors also include simple drawing and painting features involving a selection of pens, brushes, and sprays. In general, however, such programs are used for editing existing pictures rather than creating new ones. Photoshop, for example, is routinely used to retouch the photographs reproduced in newspapers and magazines.
Vector graphics
This system is used for diagrams, graphs, flow charts, engineering drawings, etc. It is suitable for relatively simple line drawings. The image is stored and manipulated as mathematical formulae producing lines, geometrical figures, and curves (e.g. Bezier curves). Regions of the illustration can be filled with colours or tints. Vector graphics are also the basis of the character outlines in scalable fonts. The main general formats are shown in the table.

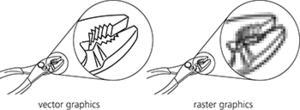
Graphics formats. The difference between vector and raster images when they are enlarged
Drawing programs
Vector graphics software is more usually used for creating images. Examples of these ‘drawing programs’ are Adobe Illustrator and Adobe FreeHand, both of which are used by commercial illustrators. Using such programs it is possible to draw lines, polygons, circles, and ellipses, and also to produce more complex Bezier curves. Freehand drawing is also possible, usually using some sort of data tablet input device. Other software is used in more specialized applications, such as computer-aided design, drawing chemical structural formulae, and producing mathematical figures. The files for vector graphics illustrations are generally much smaller than raster files. Vector illustrations are also easier to change. A particular advantage is that they are scalable—i.e. they can be enlarged indefinitely without loss of detail.
Three-dimensional graphics
A large amount of effort and money has gone into techniques for producing three-dimensional images—largely driven by the increasing use of CGI (computer graphic imaging) in the mainstream film industry. Drawing programs for three-dimensional graphics use basic figures (cube, sphere, cone, etc.) that can be distorted and patched together to form more complex shapes. These images have a vector component, which is a wireframe outline of the shape composed of a large number of small polygons. These are filled with a bitmap pattern to create the surface—a process known as rendering. In simple 3-D graphics, a sphere, for example, is a polyhedron with a large number of plane faces—the larger the number of faces, the nearer the approximation to a smooth surface (but the greater the rendering time). In more sophisticated graphics systems the surface is made up of curved Bezier patches. Three-dimensional graphics programs also include facilities for displaying the scene from different viewpoints and for lighting it from different angles, with automatic generation of highlights and shadows.
Formats for graphics files
File
Uses
Extension
Raster formats
Windows bitmap
Used in simple screen display
.bmp
Graphic image file
A CompuServe format used for simple web pictures
.gif
JPEG
The Joint Photographic Expert Group format used for photographs in web pages and in desktop publishing
.jpg
Portable network graphics
The format recommended for web use
.png
Tagged image file format
Used for high-quality pictures in desktop publishing
.tif
Vector formats
Encapsulated PostScript
Used extensively in desktop publishing
.eps
Scalable vector graphics
Increasingly used in web pages
.svg
- flaring
- flaser bedding
- flaser gneiss
- flaser rock
- flash arc
- flashback
- flashback voltage
- flash cooling
- flash crowd
- flash drum
- flash drying
- flash evaporation/vaporization
- flash fire
- flash flood
- flash freezing
- flash memory
- flash memory controller
- range(of a function or mapping)
- range of a good or service
- Ranger
- range theory of probability
- range tracking
- range zone
- Ranjit Singh (1780–1839)
- rank