A bar chart used when data are cross-categorized according to two categorical variables. One variable is regarded as the main variable and the bars representing this variable are subdivided according to the other variable.
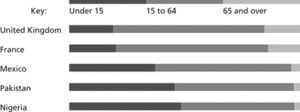
Compound bar chart. The diagram shows the similarity between the age distributions of two European countries and the difference between these and the age distributions of countries in other continents.
- Tasman, Abel (1603–c.1659)
- Tasmanian devil
- Tasmanian wolf
- T association
- taste
- taste bud
- tastes
- Tata
- TATA box
- TATA-box-binding protein
- tatoray process
- TATP
- Tatum, Edward Lawrie
- tau
- Taube, Henry
- tau particle
- Taupo
- Taurid meteors
- Taurus
- Taurus A
- Taurus Molecular Clouds
- Taurus Moving Cluster
- Taurus rocket
- Taurus X-1
- tautochrone