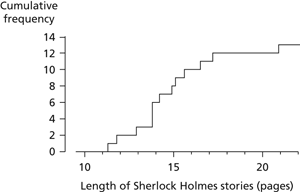
A diagram showing data values for a numerical variable in which the cumulative frequency of observations ≤ x is plotted against x. The diagram consists of horizontal segments, with jumps at the observed data values. The jump at xj represents the frequency of xj in the sample. See also cumulative frequency polygon; ogive; sample distribution function.

Step diagram. The data illustrated here are the lengths of the stories in The Return of Sherlock Holmes. Conan Doyle wrote the stories to fit regular slots in Collier's Magazine and the Strand Magazine between September 1903 and December 1904. The lengths of the stories are therefore very similar.
- chevron
- chevron fold
- chevron marks
- Chewtonian
- Chezy’s formula
- chi
- Chiang Kai-shek (1887–1975)
- Chiao, Leroy (1960– )
- chiasma
- chiastolite
- Chibis-M
- Chibis vacuum suit
- Chicago Board of Trade
- Chicago Boys
- Chicago Mercantile Exchange
- Chicago School
- Chickasaw
- chicken
- chickenwire structure
- Chicxulub
- chief executive
- chief programmer team
- Chien-lung
- Chifley, Joseph Benedict (1885–1951)
- chikungunya