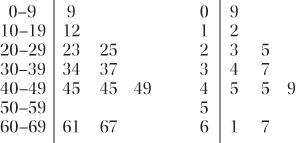
A method of displaying grouped data, by listing the observations in each group, resulting in something like a histogram. For the observations 45, 25, 67, 49, 12, 9, 45, 34, 37, 61, 23, grouped using class intervals 0–9, 10–19, 20–29, 30–39, 40–49, 50–59 and 60–69, a stem-and-leaf plot is shown on the left. If, as in this case, the class intervals are defined by the digit occurring in the ‘tens’ position, the diagram is more commonly written as shown on the right.

stem-and-leaf plot