The sample mean (or, simply, ‘the mean’) of a set of n items of data x1, x2,…, xn is , which is the arithmetic average of the numbers x1, x2,…, xn. The mean is usually denoted by placing a bar over the symbol for the variable being measured. If the variable is x the mean is denoted by . If the data constitute a sample from a population, then the sample mean is an unbiased estimate of the population mean.
For example, the numbers of eruptions of the Old Faithful geyser during the first eight days of August 1978 were 13, 13, 13, 14, 14, 14, 13, and 13. The mean is

If the data are collected in frequency form so that values x1, x2,…, xn are obtained with frequencies f1, f2,…, fn the mean is
 For example, with the eruption data there are just two values, x1=13 and x2=14. Their respective frequencies are f1=5 and f2=3, so the mean is {(5×13)+(3×14)}/(3+5)=13.375.
If the data are grouped into classes with mid-values x1, x2,…, xc and corresponding class frequencies f1, f2,…, fc, an approximate value for the mean of the original data is the grouped mean

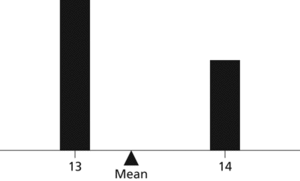
The mean can be interpreted as the centre of gravity, or centre of mass, of a system of particles of masses f1, f2,…,fn at points x1, x1,…, xn.

Sample mean. The data are the numbers of eruptions of the Old Faithful geyser during the first eight days of August 1978. The sample mean is seen to be the balance point of the observations.
- special drawing rights
- special economic zone
- special function
- special interest group
- speciality (specialty) chemicals
- specialization
- specialization/generalization
- specialized search engine
- special linear group
- Special Liquidity Scheme
- special relativity
- special theory of relativity
- speciation
- species
- species diversity
- species evenness
- speciesism
- species longevity
- species richness
- species selection
- species zone
- species–area relationship
- specific
- specific activity
- specification