The application of statistical methods to the maintenance of quality standards in a production or other process. Methods include acceptance sampling to make decisions on whether to take delivery of products and control charts to identify when modification to a process is required.
The analysis of a sequence of small samples taken at regular intervals from the output of an industrial production process, with the aim of ensuring that the output meets its required specification.
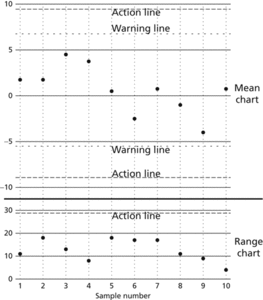
Standard statistical procedures expect large samples whereas here the samples are small. The solution suggested by Shewhart was the use of a control chart (Shewhart chart). The basis of this chart is a simple plot of the successive sample means, though often a simultaneous parallel chart of some measure of spread is maintained. The purpose of the chart is to give a quick visual indication of any trends in the production process (e.g. a drift in the mean), or an increase in variability (possibly a consequence of some problem in part of the process), without the need for advanced statistics. The diagram illustrates a combined mean chart (x̄- chart) and range chart (R-chart).
On the x̄-chart are two pairs of lines: warning lines and action lines. If any sample mean lies outside an action line, or if a succession of sample means lie outside the warning lines then production is stopped. One set of rules to have found favour are the Western Electric Rules which state that the process should be judged out of control if any of the following occur:
1. The sample mean is more than three standard errors from the notional mean (this is the three-sigma rule);
2. The sample mean and one of its two predecessors are more than two standard errors from the notional mean (and on the same side of it);
3. The sample mean and three of its four predecessors are more than one standard error from the notional mean (and on the same side of it);
4. The sample mean and its seven predecessors all lie on the same side of the notional mean.
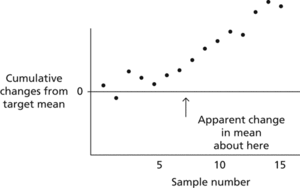
An alternative to the control chart is the cumulative sum chart (cusum chart). If x̄j denotes the j th sample mean and m denotes the expected mean of the production process, then, on the cusum chart, is plotted against k. If production is normal then the plot will be roughly horizontal, whereas a trend indicates a departure from the expected mean. See acceptance sampling.

Quality control. This quality control chart plots the values of sample means (upper graph) and ranges (lower graph) as a function of time. If a value falls beyond an action line, or if a succession of sample means lie outside the warning lines, then production is stopped.

Cumulative sum chart. Small changes in mean show more clearly on a cusum chart than on a control chart.
A set of procedures or planned system of activities used to ensure that a manufactured product from a process or a service meets a defined set of standards or criteria. For example, a product may be required to contain a maximum level of impurity, achieve a certain density specification, or have a certain viscosity. The standards may be set by the customer or by a regulatory body, as is the case with pharmaceutical manufacture. Not all the product manufactured is required to be tested but instead representative random samples are taken and tested. Where unacceptable statistical deviations are found, remedial action is required to correct the process in order to achieve the prescribed quality control standards.
The use of sampling, inspection, and testing methods at all levels of system production to produce defect-free hardware and software.
The system for checking the quality of a product. This may be done before it is sold, and/or at earlier stages of production. Where the checking itself destroys or is liable to damage the product, quality control has to work via sampling batches of products chosen so that they are expected to have common properties, for example those processed on a given date by the same machine. The level of spending on quality control is affected both by commercial considerations of maintaining a reputation for quality, and by legal sanctions imposing penalties or awarding damages for defective products.
- last mile
- last quarter
- La Superba
- LATA
- latch
- latching
- latch-up
- Late-Devensian Interstadial
- late-glacial
- late heavy bombardment
- latency
- latent class model
- latent heat
- latent heat of transition
- latent learning
- latent period
- latent root
- latent variable
- latent vector
- latent virus
- lateral
- lateral accretion
- lateral accretion deposit
- lateral dispersion
- lateral erosion