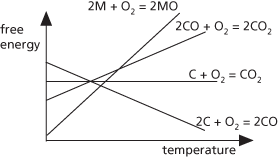
A diagram used to show the conditions under which a metal oxide can be reduced to a metal. The standard Gibbs free energy of formation of the oxide is considered, for example,
This value, ΔG⦵, is plotted against temperature. In general, the result is a straight line. In some cases, there is an abrupt change in the line’s slope at a point because of a phase change. The value of ΔG⦵ for the reducing agent is also plotted. For example, if the reducing agent is carbon forming carbon dioxide, it is ΔG⦵ for the reaction
Reduction can occur in the range of temperatures in which the carbon curve is lower than the metal curve. The diagram was devised by the physical chemist Harold T. Ellingham (1897–1975) in 1944.

Ellingham diagram
A graphical representation of the dependence of temperature on the stability of compounds, particularly for the reduction of metal oxides and sulphides. The diagram is used to predict the equilibrium temperature between a metal, oxygen, and the metal oxide, and therefore the reduction of an ore to the metal. It is, in effect, a graphical form of the second law of thermodynamics as a plot of the Gibbs free energy (ΔG) for the oxidation reaction with absolute temperature. The diagram is named after British chemist Harold Johann Thomas Ellingham (1897–1975).
- TCP-IP
- TCP/IP
- Las Casas, Bartolomé de (1474–1566)
- Laschamp
- Las Cumbres Observatory Global Telescope Network
- laser
- laser altimeter
- laser cooling
- laser diffraction microscopy
- laser diode
- laserdisk
- Laser Geodynamics Satellite
- Laser Interferometer Space Antenna
- laser printer
- laser range finding
- laser ranging
- LAser RElativity Satellite
- laser ring gyroscope
- laser scanning
- laser spectroscopy
- La Silla Observatory
- Laspeyres, Ernst Louis Étienne (1834–1913)
- Laspeyres index
- Laspeyres price index
- Lassaigne’s test