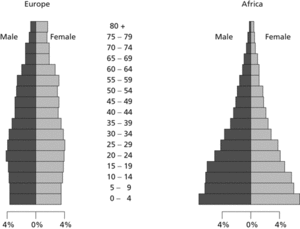
A diagram for representing the age distribution of a population. It is really a histogram in which age is plotted vertically and frequency, or relative frequency (i.e. proportion), is plotted horizontally. Often drawn as a back-to-back pyramid with one side for males and the other side for females. Paired pyramids can be used to compare two populations.

Population pyramid. The pyramids show the age distribution, by sex, for typical European and African nations. The pyramids have the same total area, so the wide base of the African pyramid reflects the high birth-rate, and its fast-tapering shape indicates the low expectation of life.
See age–sex pyramid.
- countervailing power
- counting
- counting numbers
- counting problem
- counting process
- count noun
- count rate
- country code
- country code top level domain
- country rock
- Countryside Stewardship Scheme
- counts
- couple
- coupled
- coupled equations
- coupled human-environment system
- coupled substitution
- coupling
- coupling constant
- coupling constraint
- coupling reaction
- coupon
- coupon code
- coupon-collecting distribution
- courage