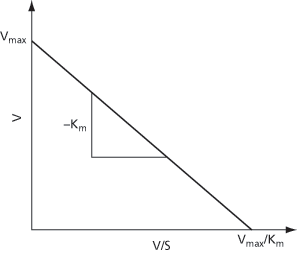
A graphical method used to obtain a straight line from experimental data from enzyme kinetics (see Fig. 18). It involves forming a plot of V/S versus V in which S is the substrate concentration at which the velocity v is observed. The gradient of the line is equal to –Km and the intercept on the y-axis is equal to the maximum velocity V. It is named after Canadian biochemist George Sharp Eadie (1895–1976) and B. H. J Hofstee who developed the plot in 1942 and 1959, respectively. See michaelis–menten kinetics.

Fig. 18
- urban village
- Urca process
- urea
- urea cycle
- urea nitrate
- urea–formaldehyde resins
- ureilite
- ureotelic
- ureter
- urethane resins
- urethra
- Urey, Harold Clayton
- Urey, Harold Clayton (1893–1981)
- URI
- uric acid
- Uriconian
- uricotelic
- uridine
- urinary system
- urine
- uriniferous tubule
- URL
- URL redirection
- urn model
- Urochordata