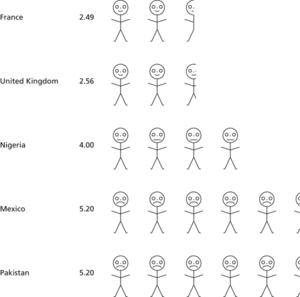
A diagram in which frequency or quantity is represented by symbols that are small images of the objects or material being counted. The diagram should indicate exactly how many, or how much, each symbol represents.

Pictogram. The diagram shows, for 1984, the average number of people per dwelling in five countries. In the diagram each extra stick person represents one extra person per dwelling. The two European countries are very similar and differ markedly from the other countries.
- CHDL
- Cheapernet
- cheap money
- Chebotarev sequence
- Chebyshev approximation, norm
- Chebyshev distance
- Chebyshev filter
- Chebyshev inequality
- Chebyshev, Pafnuty Lvovich (1821–94)
- Chebyshev polynomials
- Chebyshev–Hermite polynomials
- Chebyshev’s inequality
- Chebyshev’s Theorem
- Chechnya
- check
- check box
- check character
- check dam
- check digit
- checkers-playing programs
- checking account
- checking program
- checkout
- checkout page
- checkpoint