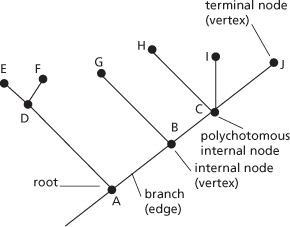
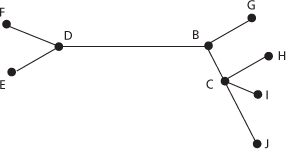
A diagram representing the evolutionary relationships and distances between different groups or species of organisms using data obtained by phylogenetic methods, such as comparative morphology or sequence analysis of nucleic acids and proteins. The relationships are depicted by (usually) dichotomously branching lines to form a treelike pattern, with the lengths (or weights) of the branches proportional to the distance of the relationship in evolutionary terms. A rooted tree is one that specifies the oldest common ancestor and depicts the evolutionary splits in chronological sequence. An unrooted tree (sometimes called a star diagram) is one that does not specify the oldest common ancestor, and thus the evolutionary origin: it indicates relationships but not evolutionary direction. As shown in the diagram, a tree consists of nodes (or vertices) connected by branches (or edges). In a rooted tree the earliest group to diverge is called the basal group, represented by D and its descendants E and F. If a node splits into three or more branches (as at C in the diagram) it is described as polychotomous, and the tree is said to be unresolved. A simple cladogram is similar to a rooted tree but shows only the relationships, not their evolutionary distance (see cladistics).

Phylogram: rooted tree

Phylogram: unrooted tree
- high-temperature superconductor
- high tension
- high-tension
- high-velocity cloud
- high-velocity scanning
- high-velocity star
- high-voltage test
- highway
- highwaymen
- H II region
- H-II Transfer Vehicle
- Hilbert, David
- Hilbert, David (1862–1943)
- Hilbert space
- Hilbert-style calculus
- Hilbert’s basis theorem
- Hilbert’s paradox
- Hilbert’s programme
- Hilbert’s tenth problem
- Hilda group
- Hildebrand rule
- Hill, Archibald Vivian
- hill climbing
- hill-climbing
- Hiller borer