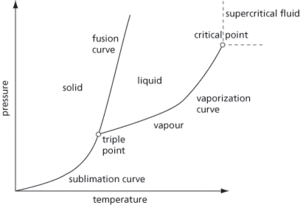
A graph showing the relationship between solid, liquid, and gaseous phases over a range of conditions (e.g. temperature and pressure).
A graph showing the range of temperatures and pressures at which a substance can exist as a solid, liquid, or gas. These different physical states are known as phases, and the temperatures and pressures under which each phase exists are represented by an area on the diagram. A line between two areas defines the conditions under which two phases can exist in equilibrium. The triple point is the only point on the diagram where conditions are such that the solid, liquid, and gas phases can coexist in equilibrium.
A graph showing the relationship between solid, liquid, and gaseous phases over a range of conditions (e.g. temperature and pressure). See steel (illustration).
A diagram representing the relationship of solid, liquid, and gaseous phases over a range of temperatures and pressures (see Fig. 36 for a typical example). Phase diagrams for pure substances of pressure and temperature show the existence of triple and critical points. Phase diagrams for binary mixtures showing liquid and gaseous phases at constant temperature illustrate the variation of pressure, and where tie lines join the two phases in equilibrium. Phase diagrams for binary mixtures such as metals with temperature show the existence of eutectic points. The liquidus is the line or curve between liquid and liquid/solid at equilibrium, and the solidus is the line or curve between solid and liquid/solid at equilibrium.

Fig. 36 Phase diagram
Graph to show fields of stability for phases in a heterogeneous system; variables such as temperature, pressure, and concentration are plotted against each other.
- COSHH
- cosine
- cosine potentiometer
- cosine rule
- cosine wave
- COSMIC
- cosmic abundance
- cosmic abundance of elements
- Cosmic Background Explorer
- cosmic background radiation
- cosmic censorship
- cosmic dust
- cosmic-dust analyser
- cosmic magnetic fields
- cosmic microwave background
- Cosmic Microwave Background Polarization
- cosmic neutrino background
- cosmic radiation
- cosmic rays
- cosmic-ray shower
- cosmic-ray subsystem
- cosmic-ray track
- cosmic scale factor
- cosmic string
- cosmic year